In today’s cloud-native, microservices-driven backend architectures, logs, metrics, and traces are growing exponentially. While traditional monitoring tools capture vast amounts of data, AI-powered observability takes monitoring to the next level — providing context-aware insights, real-time anomaly detection, and summarized alerts using LLMs like GPT-4, Claude, and others.
In this blog post, we explore:
-
🔍 How AI and AIOps are transforming backend observability
-
💬 Using LLMs to summarize logs, exceptions, and alerts
-
⚖️ Tooling comparison: Datadog + AI vs. Prometheus + GPT
-
🧠 Best practices, architecture tips & real-world use cases
🧠 1. The Rise of AIOps: Smarter Monitoring for Modern Systems
What is AIOps?
AIOps (Artificial Intelligence for IT Operations) uses ML and AI models to enhance how we monitor, analyze, and act on system data such as:
-
Logs (errors, requests, stack traces)
-
Metrics (CPU usage, latency, memory)
-
Traces (distributed request chains)
-
Events & incidents
AIOps Use Cases
-
📊 Anomaly detection: Identify unusual behavior before incidents occur
-
🧩 Root cause analysis: Automatically detect where and why an issue started
-
🔁 Alert deduplication: Combine repeated alerts to avoid fatigue
-
🧠 Predictive monitoring: Forecast issues based on trends
-
🧯 Noise reduction: Filter irrelevant logs or low-priority events
Tools that Offer AIOps
| Tool | AIOps Capabilities |
|---|---|
| Datadog | Built-in anomaly detection, error clustering, AI-generated incident context |
| Logz.io | AI-enhanced logging with root cause suggestions |
| Aisera | AI-based incident clustering and automation |
| Grafana Cloud (AI Tools) | Pattern recognition, log summaries, and error explanations |
💬 2. Using LLMs to Summarize Logs, Exceptions & Alerts
Traditional monitoring sends alerts with raw data: stack traces, server errors, metrics charts. AI enhances this by summarizing and explaining what happened in plain language.
🔧 Use Cases for LLMs in Observability
-
Post-deployment log summaries:
“After deploy, service X saw a spike in 500 errors related to Redis timeouts.”
-
Grouped exception summaries:
“20 instances of
NullPointerExceptionin auth-service between 10:00–10:10 UTC.” -
Smart alerting:
“Disk usage on node-4 hit 95%—likely due to new log volume from backup-job.”
-
Incident debrief automation:
-
Auto-generate incident reports from logs, tickets, and alerts
-
⚙️ Prompt Engineering for Logs
-
Add context: service name, time range, severity
-
Filter noise: Ignore routine INFO or DEBUG logs
-
Use chunking: Summarize logs in batches, then aggregate
-
Use system-specific patterns: e.g., Kubernetes events, nginx logs
Sample Prompt to GPT:
You can also fine-tune or use few-shot learning for more accurate summaries.
⚖️ 3. Tools Comparison: Datadog + AI vs. Prometheus + GPT
Let’s compare two popular approaches to implementing AI in observability:
| Feature | Datadog + AI | Prometheus + GPT (Custom Stack) |
|---|---|---|
| Setup | Plug-and-play, fast time-to-value | Manual, flexible, requires integration |
| LLM Summarization | Built-in (limited customization) | Fully customizable prompts, APIs |
| Alert Handling | Advanced correlation & deduplication | DIY alert logic with GPT summaries |
| Data Ownership | Cloud-based (your data in their infra) | Can be self-hosted or more private |
| Cost | Scales with usage, often expensive | Lower infra cost, GPT usage may vary |
| Scalability | Highly scalable SaaS | Depends on your infrastructure |
| Latency | Real-time, optimized | LLMs may introduce delay unless async |
🤔 Which Should You Choose?
-
Choose Datadog + AI if you want quick setup, strong built-in features, and a vendor-managed solution.
-
Choose Prometheus + GPT if you want control, open-source freedom, and customizable AI logic.
-
Hybrid model: Use GPT only for specific summarization or alert annotation while keeping your existing stack.
🛠️ 4. Sample Architecture: AI + Observability Stack
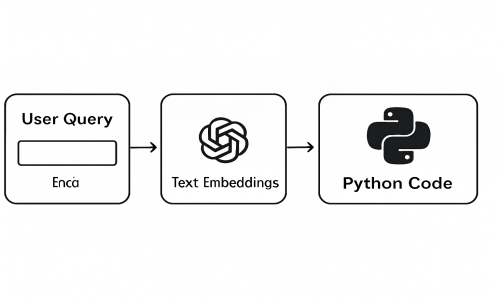
Here’s how you can integrate AI/LLMs into your backend observability system:
Breakdown
-
📥 Input: Logs, metrics, traces from services
-
📊 Analysis: Alert triggers + AI summarization of context
-
📤 Output: Human-readable summaries delivered via chat, email, or dashboards
✅ 5. Best Practices
| Area | Recommendation |
|---|---|
| Instrumentation | Use structured logs (JSON), tags (service, env, trace_id) |
| Data Volume | Chunk logs before sending to LLMs |
| Privacy | Mask sensitive data (e.g. user emails, passwords) |
| Feedback Loop | Let engineers rate AI summaries to improve accuracy |
| Cost Control | Use GPT-3.5 for general use, GPT-4 only when needed |
| Security | Store logs safely, avoid PII in prompts |
| Monitoring the Monitor | Track GPT usage, latency, failure to summarize, etc. |
🚫 Common Challenges
-
LLM Limitations: Token limits, hallucinations, vague explanations
-
Cost Management: High-frequency logs + GPT-4 can get expensive
-
Alert Fatigue: Even AI-generated alerts can become noisy
-
System Drift: As apps evolve, prompts and logic may need updates
-
Latency: GPT-based summaries may not be real-time unless well-optimized
🔚 Conclusion
AI-powered observability is no longer a futuristic concept — it's a current necessity. By combining real-time monitoring with intelligent summarization, engineering teams can:
-
Reduce mean time to resolve (MTTR)
-
Cut through the noise
-
Understand incidents faster
-
Make smarter operational decisions
Whether you choose a managed tool like Datadog, or build your own with Prometheus + GPT, the key is to start small, iterate fast, and build trust in your AI-enhanced monitoring stack.

